Solar Installer Pay: What You Actually Earn in 2026 by State and Market
Quick Answer
Solar installers in the US earn between $19 and $35 per hour in 2026, with a national median around $24 to $26 per hour for experienced field workers. Pay varies significantly by state, project type, and role level. Utility-scale solar consistently pays more than residential, and workers with electrical certifications or crew lead responsibilities can push well above the median. Top-paying states include California, New York, Hawaii, Massachusetts, and New Jersey. Entry-level helpers typically start at $17 to $20 per hour, while lead installers and foremen on commercial and utility projects earn $30 to $40 or more.
What Solar Installer Pay Actually Looks Like in 2026
Solar installation is one of the fastest-growing trades in construction, and the pay has moved with that demand. The Bureau of Labor Statistics classifies solar photovoltaic installers under SOC code 47-2231 and reported a national median hourly wage of $23.08 as of the most recent data cycle. When you factor in overtime, per diem on larger commercial and utility projects, and market-specific adjustments, many experienced installers are realistically earning $28 to $35 per hour in 2026.
The number on your pay stub depends on more than just showing up. Project type matters more than most workers realize when they are evaluating an offer. Residential solar pays at the low end of the range. Utility-scale ground-mount projects in high-growth markets pay at the top. Commercial rooftop work typically lands in between.
The national median for solar PV installers is $23.08 per hour, but experienced field workers on utility-scale projects in high-demand states routinely earn $30 to $38 per hour in 2026.
Pay also varies by employer type. Large utility-scale EPC contractors, the companies building 50 to 500 megawatt solar farms, generally pay more than residential installation companies. They offer more overtime, more consistent work schedules, and often per diem for workers who travel to project sites. If maximizing earnings is the goal, knowing which segment of the solar market you are targeting is the most important variable to understand.
Solar Installer Pay by State: The Top and Bottom Markets
Table 1 · Solar Installer Pay by State — 2026 Estimates
Median and upper-range (75th percentile) hourly wages for experienced solar PV installers. Upper-range reflects commercial and utility-scale projects, not outliers. Data sourced from BLS OEWS (SOC 47-2231) with 2026 market adjustments.
| State | Median Hourly (Experienced) | Upper Range (75th Pct) | Market Notes |
|---|---|---|---|
| California | $32–$34 | $38–$42 | Largest solar market in the US. Strong prevailing wage enforcement. High demand for electrically licensed workers. |
| New York | $28–$32 | $35–$40 | Active utility and commercial pipeline. NYC metro inflates upper range. Prevailing wage on most public projects. |
| Massachusetts | $27–$31 | $34–$38 | Dense commercial and community solar market. Strong state incentives driving consistent project flow. |
| New Jersey | $26–$30 | $33–$37 | High rooftop and ground-mount density. Industrial and commercial work drives upper-range rates. |
| Hawaii | $27–$31 | $34–$38 | High cost of living offset. Utility-scale and storage projects drive demand. Electricians in especially short supply. |
| Texas | $22–$26 | $29–$34 | Largest utility-scale solar pipeline in the US. Lower base wages but high OT and per diem on large West Texas projects. |
| Arizona | $22–$25 | $28–$33 | Year-round work. High utility-scale project volume. Per diem common on remote desert site projects. |
| Florida | $21–$24 | $27–$32 | Fast-growing utility and residential market. Wages tracking upward with project volume increases since 2023. |
| Nevada | $23–$27 | $30–$35 | Large utility farms in southern Nevada. Strong prevailing wage on public work. Competitive market for experienced workers. |
| North Carolina | $20–$23 | $26–$30 | One of the top solar states by installed capacity. Competitive wages relative to regional construction norms. |
| National Median | $23–$26 | $30–$35 | BLS SOC 47-2231 national median $23.08/hr. Upper range reflects utility/commercial experienced workers in 2026. |
Sources: BLS OEWS SOC 47-2231, labor market survey data. Figures represent 2026 estimates for experienced workers (2+ years). Entry-level helpers earn $17–$21/hr across most markets. Upper-range figures reflect 75th percentile, not maximum.
State matters a lot. A journeyman-level solar installer in California earns meaningfully more than the same worker in a lower-cost southern market. The gap is not just cost of living adjustment. It reflects labor market tightness, utility-scale project density, and local wage norms in construction.
The table below compares median and upper-range solar installer pay across major solar markets. Upper-range figures reflect the 75th percentile for experienced workers on commercial and utility projects, not outliers.
California leads the country at a median around $32 to $34 per hour for experienced installers, driven by the scale of its utility solar buildout, strong residential demand, and active labor enforcement. New York, Massachusetts, New Jersey, and Hawaii round out the top five. These markets have dense project pipelines, higher prevailing wage thresholds on public work, and strong demand for workers with electrical licenses.
At the lower end, states like Arkansas, Mississippi, and parts of the rural Southeast pay closer to $18 to $22 per hour for residential and small commercial work. But even in those markets, utility-scale projects often import workers from higher-wage states and offer per diem packages that push total compensation higher than the base rate suggests.
Pay by Project Type: Utility-Scale vs. Commercial vs. Residential
Table 2 · Solar Installer Pay by Project Type and Role Level — 2026
Typical hourly base rate ranges by role level and solar project segment. Does not include overtime or per diem, which can add significantly on utility-scale work.
| Role Level | Residential Solar | Commercial Rooftop | Utility-Scale | Per Diem (Travel) |
|---|---|---|---|---|
| Helper / Laborer | $17–$19 | $18–$21 | $19–$22 | $40–$55/day if site travel required |
| Installer (1–3 yrs) | $19–$23 | $22–$26 | $24–$28 | $40–$60/day on utility travel projects |
| Experienced Installer (3+ yrs) | $22–$26 | $25–$30 | $26–$33 | $45–$65/day standard on utility projects |
| Lead Installer / Crew Lead | $24–$28 | $28–$33 | $30–$38 | $50–$65/day; lead differential sometimes separate |
| Foreman | $28–$34 | $33–$40 | $36–$48 | $55–$70/day; sometimes includes housing allowance |
| Superintendent | $40–$50 | $44–$55 | $48–$65+ | Varies; often salaried with project bonuses on utility work |
Base rates only. Utility-scale projects typically add $40–$65/day per diem and significant overtime for workers who travel to job sites. Figures represent national estimates for 2026; top-paying states (CA, NY, MA) run 15–30% above these midpoints.
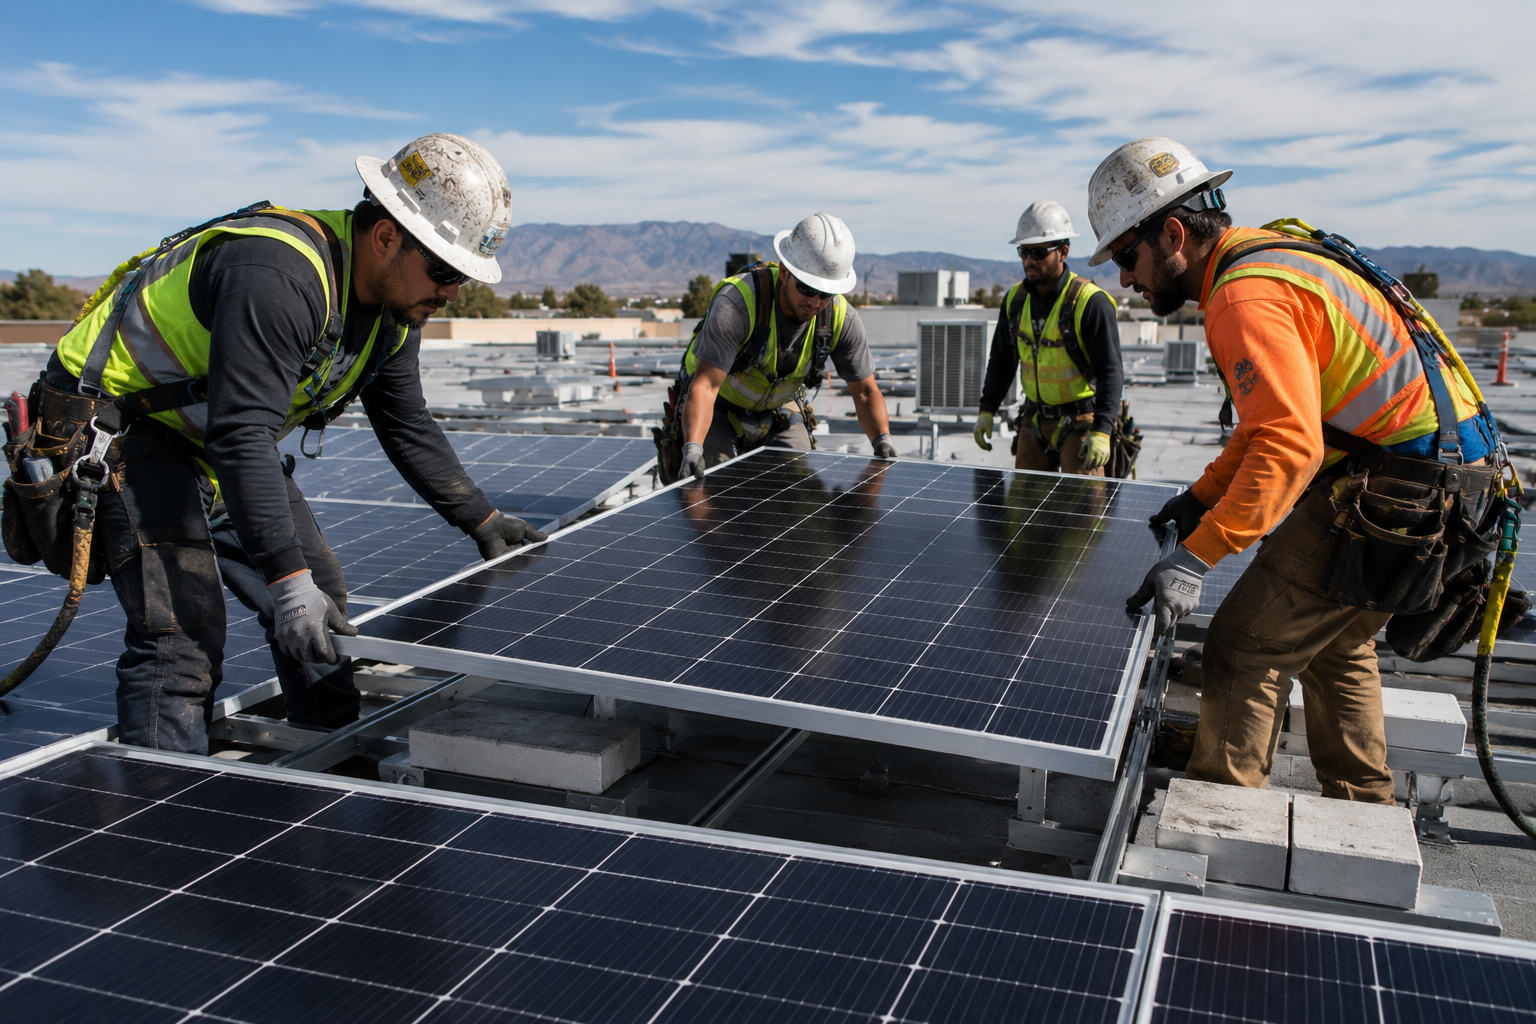
The type of solar work you do is the clearest predictor of what you earn. Residential solar is the entry point for most new installers, but it also pays the least and provides the fewest hours. Commercial rooftop work pays better and runs longer. Utility-scale ground mount work on large solar farms is where experienced installers earn the most.
Utility-scale solar installers earn 20 to 35 percent more per hour than residential solar installers in the same market. On top of that, utility projects typically include per diem of $40 to $65 per day for workers who travel to the job site.
Residential solar work typically means short job cycles, high turnover between sites, and base wages set by volume-focused companies watching margin closely. Commercial work involves longer timelines, larger crews, and more consistent pay structures. Utility-scale work looks most like heavy industrial construction in terms of pay, schedule, and how crews are managed.
For workers coming out of other construction trades, utility and commercial solar is the faster path to income parity. A pipefitter or ironworker who transitions to solar at the utility level can expect to land much closer to their previous trade wages than someone who starts in residential.
Pay by Role Level: Helper Through Lead Installer and Foreman
Solar installation has a clear role ladder, and pay reflects where you sit on it. Entry-level helpers are doing ground work, material handling, and basic racking installation under supervision. Experienced installers work independently on panel installation, wiring, and system assembly. Lead installers and crew leads supervise a small crew and are accountable for quality and pace. Foremen manage multiple crews and interface with project management.
Helper: $17 to $21 per hour. This is the starting point for workers new to solar or new to construction generally. Helpers who demonstrate mechanical aptitude and show up consistently get moved up fast in markets where labor is short.
Installer: $21 to $28 per hour. Workers with one to three years of field experience who can run panel installation, torque fasteners to spec, and work safely at height. OSHA 10 and basic electrical safety training are expected at this level.
Lead Installer or Crew Lead: $28 to $35 per hour. Workers who supervise a crew of three to six installers. Often the highest-paid non-foreman role on a utility project. Lead roles sometimes include a flat weekly differential rather than a bump in base rate.
Moving from installer to lead installer is the single highest-return step on the solar career ladder in terms of hourly pay increase per year of experience invested. Most workers who make the jump add $6 to $10 per hour.
Foreman and Superintendent: $35 to $55 per hour and up, depending on project scale. Foremen on large utility projects with 40 to 100 person crews earn in the mid to upper range. Superintendents managing multi-phase utility farms or large commercial portfolios earn at the top, sometimes with project bonuses or salary conversion.
What Bumps Your Pay Beyond the Base Rate
Table 3 · Total Annual Compensation Scenarios for Solar Installers — 2026
What a solar installer actually takes home annually across different experience levels and project situations. Figures include base wages plus overtime and per diem where applicable.
| Scenario | Base Rate | Hours / Week | Per Diem | Est. Annual Gross |
|---|---|---|---|---|
| Entry-level, residential, local market | $19/hr | 40 | None | $38,000 |
| Experienced installer, commercial rooftop | $27/hr | 45 | None | $58,000–$62,000 |
| Experienced installer, utility-scale travel project | $28/hr | 55 | $50/day, 230 days | $82,000–$88,000 |
| Lead installer, utility-scale travel project | $34/hr | 55 | $55/day, 230 days | $100,000–$108,000 |
| Foreman, utility-scale project (TX or AZ) | $42/hr | 55 | $65/day, 230 days | $125,000–$135,000 |
| Experienced installer, California commercial | $35/hr | 45 | None (local) | $75,000–$80,000 |
Annual gross estimates assume 50 work weeks. OT calculated at 1.5x for hours over 40. Per diem figures are estimated pre-tax; per diem is typically a non-taxable reimbursement, increasing its effective value. Actual figures vary by contractor, market, and project timeline.
Base pay is not the whole story. Several factors consistently push solar installer total compensation above what the headline rate suggests.
Per diem on utility projects. If you are traveling to a utility-scale site and staying away from home, contractors typically pay $40 to $65 per day in per diem. That is tax-advantaged income on top of your base rate. A worker earning $26 per hour on a 60-hour week with $55 per day in per diem is actually pulling in the equivalent of $29 to $31 per hour when you account for the full package.
Overtime. Utility-scale solar projects run long weeks, especially during the final push to energization. Workers who can sustain 50 to 60 hour weeks during peak phases earn significantly more annually than the hourly rate implies. A $26 per hour base rate on a 60-hour week with 1.5x overtime yields about $1,755 for that week before per diem.
A solar installer earning $26 per hour who works 55-hour weeks with $50/day per diem on a 9-month utility project can gross $75,000 to $85,000 in that project year, well above what the base rate alone suggests.
Certifications. NABCEP PV Installation Professional certification adds credibility and is increasingly required by tier-one EPCs for lead and foreman roles. OSHA 30 signals field leadership readiness. Electrical licenses (journeyman or master) are the highest-value credentials in solar and can add $5 to $10 per hour on commercial and utility work. Workers with a JW license who move into solar electrical work are in the highest demand category in the market right now.
How Solar Installer Pay Has Changed and Where It Is Heading
Solar installer wages have risen steadily over the past five years, driven by accelerating project demand and a construction labor market that has been consistently tight. The Inflation Reduction Act extended and expanded federal tax incentives for solar through 2032, which has locked in a long runway of project activity. Industry forecasts project solar to account for the majority of new electricity generation capacity additions in the US through the late 2020s.
What that means for workers is continued demand and, in most markets, continued wage pressure upward. The biggest bottleneck for utility-scale solar is not panels or land. It is skilled labor. Contractors who need to mobilize 200-person crews on 18-month timelines are competing hard for experienced workers, and that competition is showing up in wages, signing bonuses, and per diem packages.
The trades most naturally positioned to benefit are electricians, ironworkers, pipefitters, and laborers who already have field construction experience. Solar does not require years of solar-specific training to enter at a productive level. The physical skills transfer quickly. The workers who build that base and stack NABCEP, OSHA 30, and eventually an electrical license on top of it are the ones positioned for the top of the solar pay range through the end of the decade.
FAQ: Solar Installer Pay in 2026
How much do solar installers make per hour in 2026?
Solar installers earn between $19 and $35 per hour in 2026, depending on state, project type, and experience level. The national median is around $23 to $26 per hour for experienced field workers. Utility-scale and commercial projects pay more than residential. Workers in California, New York, and Massachusetts earn at the top of the range.
What is the average solar installer salary per year?
At a $24 per hour median with a 2,000-hour work year, a solar installer earns around $48,000 annually before overtime. Workers on utility-scale projects who log 55 to 60-hour weeks and receive per diem can realistically earn $70,000 to $90,000 in a strong project year. Foremen and superintendents on large projects earn $80,000 to over $110,000.
Which states pay solar installers the most?
California, New York, Hawaii, Massachusetts, and New Jersey consistently rank as the highest-paying states for solar installers. Median wages in California for experienced installers run $32 to $36 per hour. These states have dense project pipelines, prevailing wage requirements on public work, and strong demand for electrically licensed workers.
Does the type of solar project affect pay?
Yes, significantly. Utility-scale ground-mount solar pays 20 to 35 percent more per hour than residential solar in the same market. It also includes per diem, which adds $8,000 to $15,000 per year in tax-advantaged income for workers who travel to job sites. Commercial rooftop sits in the middle. Residential pays the least and has the shortest job cycles.
How does solar installer pay compare to other construction trades?
Solar installer pay is competitive with mid-range construction trades at the journeyman level. It lags behind licensed electricians, pipefitters, and ironworkers at the top of those trade ladders. However, the solar market is absorbing workers from those trades, and experienced electricians and ironworkers who move into solar often land at or above their previous pay, especially on utility-scale work.
Does NABCEP certification increase solar installer pay?
NABCEP PV Installation Professional certification is increasingly required or preferred for lead and foreman roles at major EPC contractors. It typically supports a $2 to $5 per hour premium at mid-career levels and signals readiness for crew lead responsibilities. For workers targeting utility-scale or commercial work, it is the most recognized solar-specific credential in the industry.
What does per diem add to solar installer earnings?
Per diem on utility-scale projects typically runs $40 to $65 per day and is paid as a tax-advantaged reimbursement rather than income. On a 250-day project year, per diem at $50 per day adds $12,500 on top of base wages. Workers who are willing to travel to project sites can meaningfully increase their annual earnings without a change in their hourly rate.
How do I find solar installer jobs that pay at the top of the range?
The highest-paying solar jobs are with large EPC contractors building utility-scale and commercial projects. These companies are not always the easiest to find through job boards. Building a verified skills profile and connecting directly with contractors hiring for specific project pipelines is more effective than applying through general listings. [Internal link: Build your Skillit profile]
Find Solar Installer Jobs That Match Your Skills
Skillit connects solar installers directly with the contractors building the biggest utility-scale and commercial projects in the country. No staffing agencies, no middlemen. Build your profile once, and let contractors in your market find you based on your actual field experience and certifications.
Build Your Skillit Profile
Union vs. Non-Union Construction: What It Means for Your Career and Pay
The Fastest Trades to Get Into With No Prior Experience
What Top Contractors Are Actually Looking for When They Hire