America’s 2026 Construction Gap: Building Faster Than Training
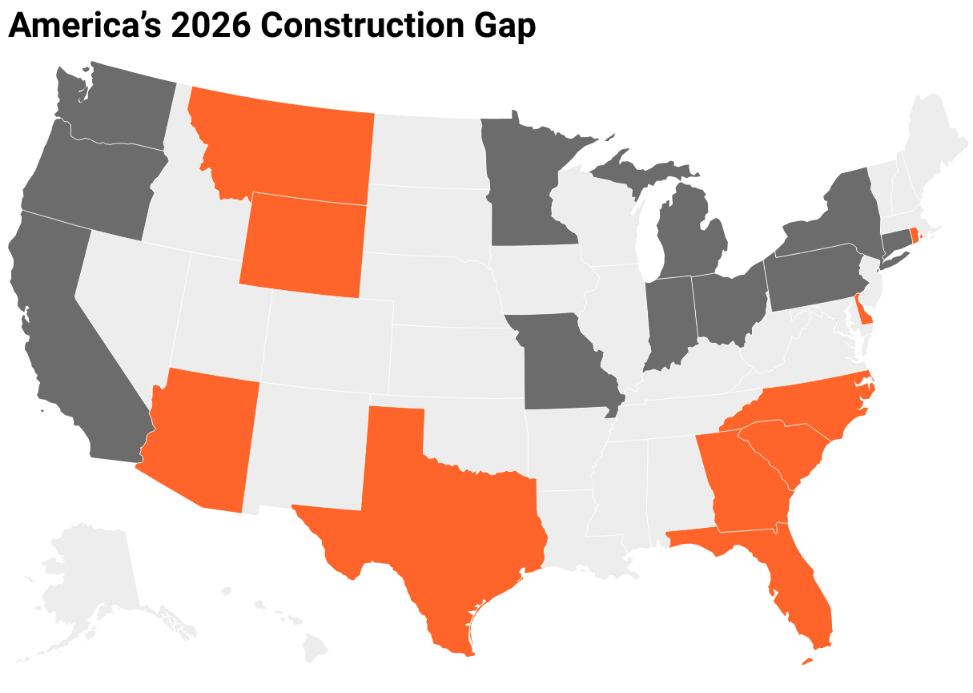
Across the United States, cranes are rising in some of the same states year after year. Housing permits remain concentrated in high-growth regions, particularly across the South and Mountain West.
The labor pipeline is not expanding at the same pace.
A new 50-state comparison of housing permits and registered apprenticeship activity shows that 40 states have demand signals that exceed workforce pipeline signals. This is not a localized labor story, but a national pattern with regional intensity. In simple terms, most of the country is permitting more homes than its formal training pipeline appears positioned to support.
That imbalance varies by state. In some markets, it reflects sheer volume. In others, rapid growth collides with limited training capacity.
The study assigns each state a “Gap Score,” which compares housing permit activity with registered apprenticeship totals. The analysis uses state-level housing permit data as a consistent, nationwide indicator of overall construction momentum. While permits reflect residential activity, they tend to move alongside broader construction cycles and labor-market tightness in many states.
A higher score means permit-driven demand appears stronger than the formal training pipeline in that state. A lower or negative score means apprenticeship activity is stronger relative to permits.

Key Findings
Texas ranks #1 with a Gap Score of 47.6, driven by 225,756 permits in 2024.
Florida ranks #2 with a Gap Score of 42.3 and 173,326 permits in 2024.
Only three states cleared 100,000 permits in 2024: Texas, Florida, and California.
California ranks #50 with a Gap Score of -64.6, reflecting the strongest apprenticeship pipeline in the study.
The top 10 states account for 685,700 permits, or 46.4% of all permits analyzed.
Rhode Island posted 50.3% permit growth, the largest year-over-year increase in the dataset.
40 states show positive gap scores, while 10 states show negative scores, where pipeline signals exceed demand signals.

These states show the widest gap between permit-driven demand and apprenticeship pipeline activity in this model.
Texas — Gap Score 47.6
Florida — 42.3
North Carolina — 27.9
Rhode Island — 27.5
Arizona — 21.5
Georgia — 21.5
Wyoming — 20.2
Delaware — 18.8
South Carolina — 18.7
Montana — 18.1
In these markets, permit volume or rapid growth appears to be outpacing formal apprenticeship expansion.

These states show apprenticeship pipeline signals that meet or exceed permit-driven demand signals in this model.
Ohio — -0.5
Connecticut — -0.8
Washington — -2.4
Missouri — -2.7
Michigan — -5.2
Pennsylvania — -5.6
Oregon — -5.8
Minnesota — -6.6
Indiana — -9.4
California — -64.6
A negative score does not imply oversupply, but rather stronger relative training capacity compared to permit activity.
The Sun Belt Still Sets the Pace
Texas and Florida sit at the top of the ranking for a familiar reason: scale.
Texas issued 225,756 permits in 2024. Florida issued 173,326. Both saw modest year-over-year declines, yet they remain at the top because building activity in these states operates on a different scale.
Population growth, commercial expansion, insurance-driven rebuild cycles, and infrastructure work overlap, driving sustained high labor demand. Even when annual permit growth slows, backlog sustains hiring pressure.
In high-volume states, demand does not need to accelerate to feel tight. It simply needs to persist.
Rapid Growth Can Strain Small Markets Faster
The story shifts in smaller states.
Rhode Island issued 1,757 permits in 2024, a fraction of Texas’ total. Yet a 50.3% year-over-year increase pushed it to #4 in the ranking. Likewise, Wyoming grew 27%. Montana rose 24.6%. Delaware climbed 23.9%.
In small labor markets, capacity is limited. A single hospital project, distribution center, or multifamily development can absorb a large share of available skilled workers, especially high-demand trades such as commercial electricians.
When growth outpaces local training activity, contractors feel it quickly. Availability tightens, bids rise, and firms are forced to recruit from neighboring states.
In these markets, the gap is less about size and more about how quickly the workforce can expand.
Apprenticeship Capacity Is Highly Concentrated
At the bottom of the ranking, apprenticeship strength shows a different perspective.
California issued 101,545 permits in 2024. It also reported 79,494 active apprentices and 27,759 new apprentices, the highest pipeline totals in the study. That depth drives its -64.6 Gap Score, the most extreme negative score in the dataset.
A negative Gap Score means the workforce training signal is stronger than the building demand signal. It does not suggest there are more workers than projects. It indicates that California’s apprenticeship pipeline is deeper relative to its permit activity.
Texas, despite leading the nation in permits, reported 21,909 active apprentices and 9,524 new apprentices.
California’s deep apprenticeship numbers reflect a long-established registered training system. Other states with high permit activity operate with smaller formal apprenticeship pipelines, relying more heavily on labor mobility and informal hiring networks.
The result is geographic asymmetry between where homes are being permitted and where workers are being trained.
Nearly Half of National Permits Sit in Higher-Gap States
The concentration of activity amplifies the issue.
The top 10 states by Gap Score account for 685,700 permits, nearly half of the 1,476,263 permits analyzed nationwide.
That means a significant share of new housing activity is concentrated in states where demand signals exceed apprenticeship signals in this index. Demand is especially acute in certain skilled trades that consistently rank among the most in-demand roles nationwide.
In tight labor markets, that imbalance tends to surface through wage competition, overtime expansion, increased labor mobility, and rising workforce fatigue. Prolonged pressure has already been linked to a growing burnout problem in construction.
Pressure spreads outward from the highest-demand hubs.
Some States Sit Near Balance
Not every state leans sharply in one direction.
Ohio’s Gap Score sits at -0.5, with demand and pipeline measures nearly aligned. Connecticut posts -0.8. New York registers 0.8.
In these states, permit activity and apprenticeship activity track more closely under this model. Hiring may still be competitive, but the structural signals appear more proportionate.
In a national conversation often framed as a uniform shortage, these differences stand out.
The Retirement Layer
Apprenticeship counts do not capture experience loss, nor do they reflect the broader structural challenges that can complicate long-term workforce planning.
Construction skews older than many industries. As experienced tradespeople retire, supervisory capacity and institutional knowledge decline. Apprentices grow the pipeline, but skill development takes time.
In states where permit demand is strong and demographic turnover is accelerating, those forces compound.
The gap is not just numeric. It is generational.
What This Ranking Signals for 2026
The Construction Workforce Gap Map does not forecast exact worker shortages. It compares relative signals across states, highlighting where permit-driven demand appears stronger than apprenticeship-driven pipeline activity.
For employers, higher-gap states may mean more competition for available talent. For workforce platforms and staffing providers, those same markets represent concentrated needs.
The broader takeaway is geographic concentration.
Construction labor pressure is not evenly distributed across the country. It clusters around growth corridors, migration patterns, and states with varying levels of training infrastructure.
In 2026, the industry conversation will center on more than national totals. It will focus on where the gap between demand and pipeline is widest, and how quickly each state can adapt.
The cranes may look similar across skylines. The hiring realities behind them are not.
Methodology
The 2026 Construction Workforce Gap Map compares two normalized state-level signals:
Demand signal (housing proxy):
U.S. Census Bureau Building Permits Survey state totals for 2024 permits
Year-over-year permit growth from 2023 to 2024
Workforce pipeline signal:
U.S. Department of Labor Registered Apprenticeship FY2021 totals for active apprentices
FY2021 totals for new registered apprentices
Each measure was min-max normalized to a 0–100 scale across all 50 states.
The Demand Index equals 70% normalized 2024 permit volume plus 30% normalized year-over-year permit growth.
The Pipeline Index equals 70% normalized active apprentices plus 30% normalized new apprentices.
The final Gap Score equals Demand Index minus Pipeline Index.
The index is designed for state-to-state comparison rather than precise labor forecasting. Building permits are used as a consistent, state-level indicator of overall construction activity and momentum. While the data reflects residential permitting, it often tracks broader construction cycles and shared labor-market pressures across trades. Apprenticeship totals reflect registered programs captured in the dataset and are not limited strictly to construction trades. Permit data from 2023 to 2024 and apprenticeship data from FY2021 are not perfectly aligned.
Supporting documentation is outlined in the original report spreadsheet.
Fair Use Policy
Users are welcome to utilize the insights and findings from this study for noncommercial purposes, such as academic research, educational presentations, and personal reference. When referencing or citing this article, please ensure proper attribution to maintain the integrity of the research. Direct linking to this article is permissible, and access to the original source of information is encouraged.
For commercial use or publication purposes, including but not limited to media outlets, websites, and promotional materials, please contact the authors for permission and licensing details. We appreciate your respect for intellectual property rights and adherence to ethical citation practices. Thank you for your interest in our research.